Base metals rose 8.95% in Q3.
Zinc – The leader of the nonferrous metals on the upside.
All base metals post gains – Double-digit percentage increases in COMEX copper, nickel, and zinc.
Iron ore rallies 25.9%.
The BDI declines by 7.58%.
In 2019, the six LME base metals were 1.74% higher from the closing level at the end of December 2018. In Q1 2020, the sector plunged 17.09%. In Q2, it came back and was 12.88% higher. In Q3, the rally continued, and the sector posted an 8.95% gain. Over the first nine months of this year, base metals were 1.68% higher. The best performing commodity in the base metals sector in Q3 was LME zinc, which rose 17.39%. LME nickel rose 12.35%. COMEX copper was 11.76% higher for the quarter, and the LME copper forwards appreciated by 9.41%. Aluminum moved 9.19% higher during the quarter, while the price of tin gained 4.27%. Lead was 1.11% higher. Meanwhile, the price of iron ore moved 25.93% higher in Q3. The Baltic Dry Index fell 7.58% after a massive gain in Q2.
Central banks around the world slashed interest rates. Monetary and fiscal stimulus programs rose to unprecedented levels throughout March. Short-term interest rates in the US fell to zero percent, and both the US Fed and ECB fired bazookas of liquidity at markets. Typically, falling interest rates are supportive of base metals and commodities prices as they lower the cost of carrying inventories. However, Q1 2020 was anything but an ordinary time in markets. The quarter ended with the number of cases of Coronaviruses and fatalities rising. Central Banks and government policies have aimed at stabilizing economies worldwide, while scientists scramble to find effective treatments and a vaccine. Healthcare systems across the globe reached the brink as professionals cared for the sick, and leaders looked to slow the spread of infections. Scientific progress is slow compared to the spread of COVID-19 and the reaction in markets. The deflationary spiral has been a symptom of the global pandemic, which is the worst since the 1918 Spanish flu that claimed fifty to one-hundred million victims. As we headed into the second quarter of 2020, the world remained on edge, and markets faced the world financial crisis since the Great Depression in the 1930s. The environment in February and March was highly bearish for the prices of base metals and all industrial commodities.
In Q2, prices rebounded as some optimism returned to the industrial commodity markets. Chinese demand began to rise, crude oil made a comeback, and base metals and other raw material prices rose. If the impact of central bank and government stimulus in the aftermath of the 2008 financial crisis is an example for industrial commodities, we could see prices move a lot higher over the coming months and years. The amount of stimulus in 2020 is far higher than in 2008. From June through September 2008, the US Treasury borrowed a record $530 billion. In May, the Treasury borrowed $3 trillion to fund stimulus. The long-term effect of liquidity, low interest rates, and quantitative easing are bullish for commodity prices. In Q3, the rally continued as the impact of government stimulus, central bank liquidity, and a falling dollar provided support for the industrial commodities. The value of the US dollar index declined by 3.52% in Q3, which was supportive of base metals, industrial raw materials, and other commodity prices. The bottom line is that the response of governments around the world supported the industrial sector of the commodities market in the second and third quarters.
The Invesco DB Base Metals product (DBB) reflects the price action in copper, zinc, and aluminum on the London Metals Exchange. The base metals tend to move together when it comes to macroeconomic issues and risk-off environments. In Q4, the global economic contraction will be the leading factor facing markets as the world looks to continue to contain the spread of the virus. However, the many prices rose to new highs for 2020 in Q3. Copper, the leader of the sector, moved back above the $3 per pound level during the third quarter and closed north of that price on September 30. On October 1, the price plunged as stocks on the LME increased dramatically at the end of Q3.
Copper
Copper is the leader of the base metals sector, and it led it lower in Q1 with a loss of 20.34% on COMEX and 22.17% on the London Metals Exchange. In Q2, LME copper was 25.61% higher, and the red metal moved 21.79% higher in the futures market on COMEX. The most recent quarter took the price of nearby COMEX futures 11.76% higher, and LME copper rose by 9.41%. Over the first nine months of 2020, the base metal moved 8.42% on COMEX and 6.96% to the upside on the LME.
In early Q1, copper traded to a peak of $2.8930 when the global pandemic began to take hold of markets and worsened throughout the quarter. The price fell to a low of $2.0595 on the continuous contract in mid-March when a V-shaped recovery began and carried the price higher throughout Q2. In Q3, the buying continued as copper rose to a peak of $3.1210 per pound.
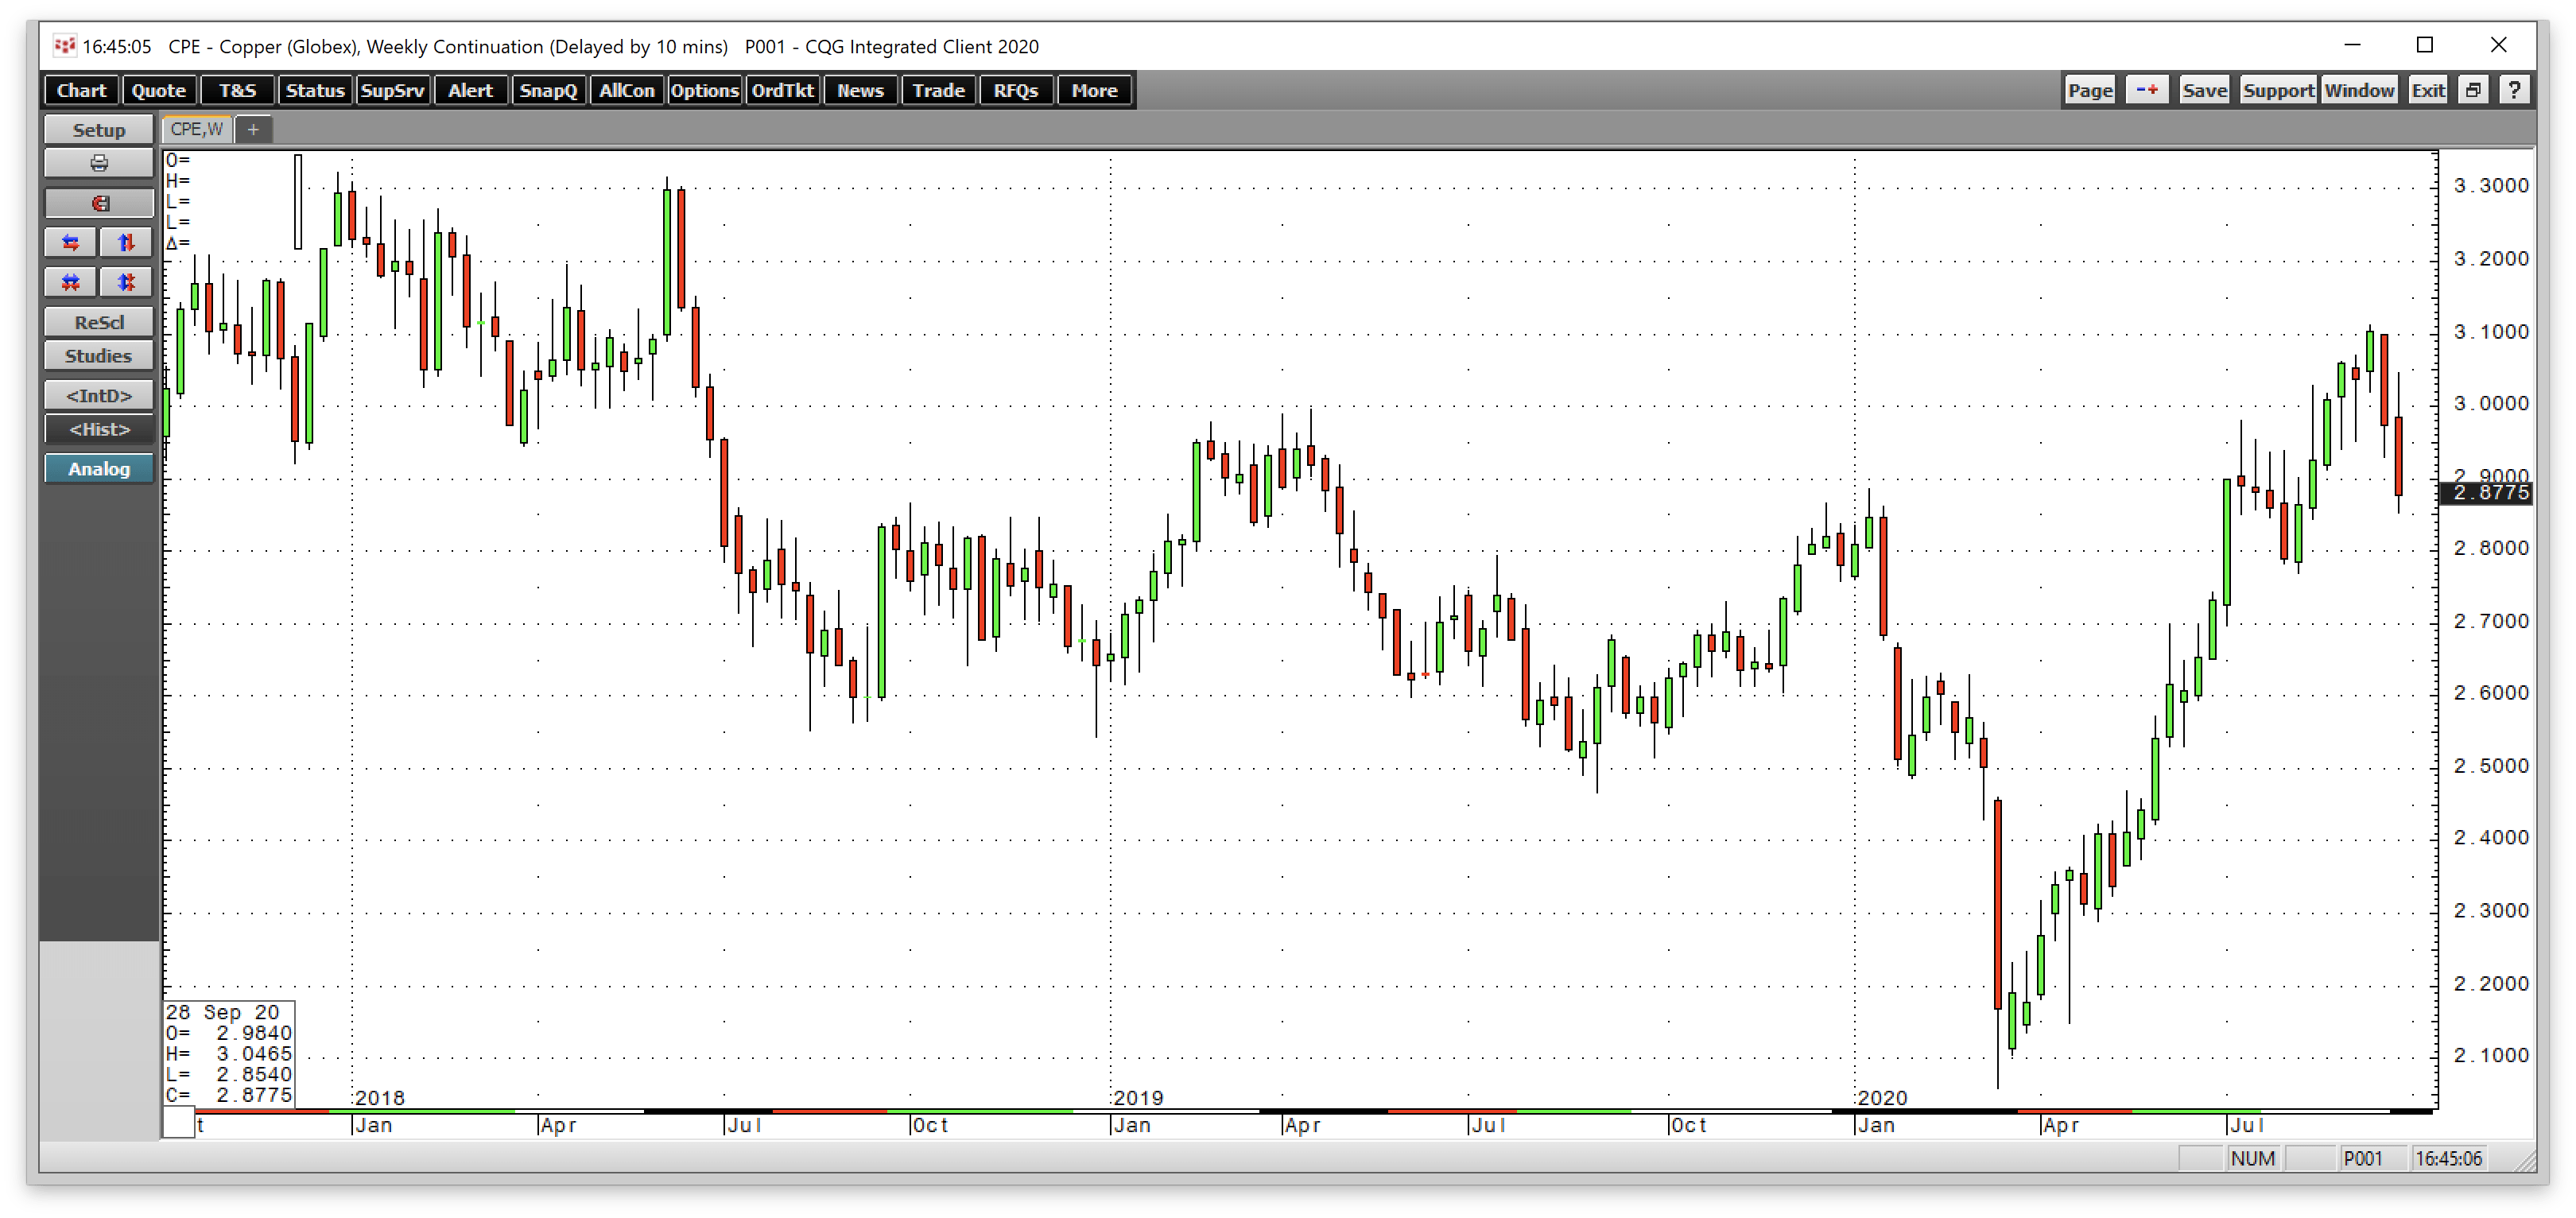
Source: CQG
As the weekly chart highlights, copper had made lower highs and lower lows since June 2018 until Q1 when it broke to the downside and moved towards the $2 level on the continuous futures contract. The recovery took the price back over the $2.70 level by the end of Q2. In Q3, copper rose over $3 for the first time since mid-2018. On October 1, the price plunged on the back of rising stockpiles.
A significant indicator of the short-term price direction of the base metal tends to be the level of LME stocks. An over 60,000-ton rise in LME inventories over the final days of the third quarter weighed on copper and caused the price to suffer a significant correction on the first trading day of October.
US interest short-term interest rates declined to the levels seen in the aftermath of the 2008 global financial crisis during Q1 and Q2 at zero percent. Fiscal and monetary policy stimulus rose to unprecedented levels since March. The Fed’s willingness to tolerate inflation above the 2% target rate, any further weakness in the US dollar, and the tidal wave of liquidity are bullish for the price of copper and other commodities.
Volatility increased dramatically in the currency markets with wide swings in the US dollar versus euro currency pair in Q1. The dollar index traded in a wide range as the crisis unfolded, but the greenback index moved higher over the first three months of 2020. The dollar index reversed and retreated in Q2. In Q3, the dollar index continued to decline. Meanwhile, the strength of the price of gold in Q2 and Q3 continues to be a flashing sign that all currencies are moving lower even though the dollar continues to be the strongest foreign exchange instrument. The dollar may be the king of currencies, but gold has been the monarch of money. Lower rates tend to be bullish for commodities prices over time, but these are anything but ordinary times in our lives. Gold reached the $2063 level in Q3, the highest price for the precious metal in history. Gold fell in late September on the back of a bounce in the dollar and risk-off concerns in the stock market. The European and US Central Banks remain highly accommodative when it comes to monetary policy.
Copper traded to lows of under $1.25 in 2008 in the wake of the world financial crisis. In 2000, the price of the red metal was 85 cents per pound. Before the mid-2000s, copper never traded above $1.60 per pound. Copper traded to a low of $1.9355 in January 2016, which is a level of critical support below the mid-March bottom at $2.0595. Copper recovered and traded to its highest price since 2018 as the potential for inflation gripped markets.
Since mid-March, the copper market experienced a V-shaped recovery that took it to a higher high for 2020. The path of least resistance for the price of the red metal at the end of Q3 remained higher. However, the price action on October 1 was sobering for the copper market as the price fell dramatically. The economic fallout from the unprecedented halt in business activity could continue to weigh on the prices of industrial commodities and base metals over the coming months and years. If 2008 is an example for the copper market, we could see far higher prices for the red metal in the coming months and years.
Nearby copper futures on COMEX settled at $3.0325 on September 30, and three-month forwards on the LME were at $6612.00 per ton. Copper was 8.42% higher on COMEX and 6.96% higher on the LME over the first nine months of 2020.
Aluminum
In Q1, LME aluminum forwards fell 16.68%, but in Q2, the market recovered by 6.40%. In Q3, bullish action in the base metals sector pushed the price 9.19% higher. Aluminum forwards on the LME were 3.20% lower over the first nine months of 2020.
While trade was the critical issue for the aluminum market in 2018 and 2019, like all other markets, the halt of the global economy on the back of the worldwide pandemic weighed on the price of the nonferrous metal leading to an almost 11.35% decline over the first half of 2020. In Q3, the base metal erased most of the loss.
Shares of Alcoa (AA) lagged the recovery in the price of aluminum and the stock market in Q3. AA shares closed Q2 at $11.24 per share and edged higher to $11.63 at the end of Q3, a rise of only 3.47%. AA shares rose 82.5% in Q2. Meanwhile, AA shares closed 2019 at $21.51 per share and remained at almost half that price level at the beginning of Q4. AA outperformed the price action in aluminum and the stock market in Q2 but underperformed in Q3.
Three-month aluminum forwards on the LME traded in a range from $1459.50 to $1826 so far in 2020 and closed at the end of September closer to the high end of the trading band for 2020. Aluminum closed Q3 at $1770.50 per ton.
Nickel
In Q1, the price of nickel forwards on the LME posted a 19.73% decline as risk-off conditions trumped all other fundamental and technical factors. In Q2, nickel came storming back with a 13.85% gain. In Q3, the buying continued, pushing the price 12.35% higher. Over the first nine months of 2020, nickel was 2.47% higher as the third quarter turned a loss into a gain for 2020. Rising demand for batteries and stainless steel sent the price of the base metal higher as it posted its second consecutive double-digit percentage gain. In Q2 and Q3, nickel rose with the rest of the base metals sector, following copper’s lead in the sector.
The rise in Tesla shares and the company’s increasing production is a supportive factor for the demand for nickel. Elon Musk called for an increase in “clean nickel” production in Q3, which helped propel the price higher. I would not be surprised to see the engineer and billionaire make an acquisition in nickel mining in the coming months and years to satisfy the rising demand from his company.
When it comes to nickel, iron ore, and steel demand are substantial factors for the price of the nonferrous metal. Nickel is highly sensitive to changes in global economic conditions, as we witnessed in 2020. Nickel is a very volatile metal, and we could see a wide price range for the metal in Q4, but the bias is now to the upside as copper has led the sector higher. Stimulus and weakness in the US dollar underpin the price of nickel as we head into the final quarter of 2020.
The decline in the value of currencies could cause some inflationary pressures that could boost the price of nickel. Three-month nickel forwards closed Q3 at $14,423 per ton, closer to the high than the low of the trading range in 2020, which was from $11,142 to $15,697 per ton. Nickel made higher highs in Q3. Demand from electric cars supports of the price of the nonferrous metal, but the global pandemic will continue to be the most significant issue facing all markets. Nickel is likely to continue to follow copper’s lead in Q4 and 2021.
Lead
In Q1, LME lead forwards were the best performing metal on the exchange with an 11.23% loss. In Q2, three-month LME lead forwards moved 4.83% higher. In Q3, the base metal rose by 1.11% and closed on September 30, 2020, at $1,821.50 per ton. Lead was still 5.91% lower over the first nine months of 2020.
Demand for batteries around the world is supportive of the price of the toxic base metal. China is, by far, the world’s largest producer and consumer of lead and the biggest player in the market, which lends the price of the metal to price manipulation. The Chinese anti-pollution policies have increased the demand for electric automobiles, which is supportive of the price of lead. There is some degree of correlation between the price of oil and lead as higher oil prices increase the demand for electric vehicles and falling oil prices do the opposite. Crude oil tanked in Q1, which weighed on lead as the virus and risk-off conditions were overwhelming. The energy commodity rebounded to the $40 per barrel level in Q2 and Q3, which helped lead post a gain for the last two quarters. Economic expansion or contraction around the globe will be the most significant factor for the price of lead in Q4 and beyond. On a longer-term basis, lead is a promising metal because of its consumption in batteries, a global market that continues to grow.
Lead traded in a range from $1598 to $2026 over the first nine months of 2020. Lead closed above the midpoint of its 2020 trading range at the end of September, but it did not move outside the band over the past three months.
Zinc
In Q1, the price of zinc declined by 17.93%. In Q2, the price rebounded by 9.98%, and in Q3, zinc was the best-performing base metal with a 17.39% gain. The move in Q3 shifted a loss for the year to a gain, pushing zinc 5.96% higher over the first nine months of 2020. Three-month zinc forwards on the LME closed at $2426.50 per ton on September 30, 2020.
In Q1, the global pandemic sent the price below $2000 per ton, which was a level of technical and psychological support. In Q2, zinc traded on either side of the $2000 per ton level. In Q3, the metal returned to the $2500 level as it rose to a new high for 2020 and closed above $2400. Coronavirus hit all of the base metals in Q1, and the zinc market was no exception. In Q2, zinc followed copper and the other metals as they recovered in Q3, zinc led the sector with an over 17% gain.
Tin
Tin is the most volatile and illiquid metal traded on the LME. In Q1, tin added to the losses of past years with a decline of 14.78%, but in Q2, the price moved 16.93% higher. In Q3, tin followed the other base metals, posting a gain of 4.27% and was 3.82% higher since the end of 2019.
China is the world’s largest producer and consumer of tin. Indonesian output is on the decline, but in other areas of the world, it has risen. Above $20,000 per ton, things got dicey for tin throughout 2017, but economic growth in China provided stability and support for the price. The $20,000 had become the pivot point for the price of three-month tin forwards. In 2019, the price moved away from the level on the downside. In Q1, tin dropped below the $15,000 level, but it recovered in Q2 and Q3. Three-month tin forwards on the LME closed at $17,494 per ton on the final day of September. Tin traded in a range from $13,375 to $18,379 so far in 2020 and closed nearer to the high of the trading band this year.
The bottom line
Base metals and industrial commodities are heading into the final quarter of 2020 after recovering from the worst period since 2008 and perhaps the 1930s when it comes to the overall economy. The world remains at war with an invisible and microscopic enemy at the end of Q3. The virus does not discriminate because of nationality and borders, race, religion, wealth, sexual orientation, or political ideology. Coronavirus is a reminder that all of the people on the planet are in the same boat when it comes to battling a health emergency. The impact on markets has been dramatic, but it is only a symptom of the global pandemic. Central banks and leaders can treat the effects of the virus, but the answer to the crisis is in the hands of scientists looking for effective treatments and a cure and the health professionals who are selflessly treating the ill. The global supply chain continues to provide essentials to people around the globe, but the economic fallout will be substantial. The longer the virus remains out of control and spreads around the planet like wildfire, the higher the financial cost. However, life comes first, and the economic factors a distant second. The stimulus stabilized the situation in Q2 and Q3 and led to significant recoveries in all of the base metals, which posted across the board gains for the second consecutive quarter. As I wrote at the end of Q2, “If 2008 is a model for 2020, prices could continue to move higher over the coming months and years.”
At the end of Q4 2019, I wrote, “Any risk-off period during 2020 has the potential to cause selling in this sector of the commodities market.” No one expected a risk-off period caused by a virus, which has become the most significant black swan event of our lifetime. Fundamentals and technical factors will continue to take a backseat to the progression of the virus in the short-term. However, price cycles will eventually lead to price bottoms. As production grinds to a halt in an environment of collapsing prices, inventories will begin to fall, leading to price bottoms. The world will emerge from the ashes of Coronavirus, and base metals are the building blocks of infrastructure. The cure for low prices in commodities is low prices, as we learned since the March 2020 lows.
Each non-ferrous metal traded on the London Metal Exchange has different supply and demand fundamentals. Some of the metals were in deficit, and some had surplus inventories when the pandemic emerged.
The price of iron ore, the main ingredient in steel, in Q1, nearby iron ore futures fell 9.66%. In Q2, they rallied by 19.05%. In Q3, iron continued to post substantial gains of 25.93% and was 35.45% higher over the first nine months of 2020. Nearby iron ore futures finished Q3 at $123.98 per ton.
The Baltic Dry Index fell 49.72% in Q1. In Q2, it exploded 227.37% higher. In Q3, the BDI fell by 7.58%. The BDI tends to experience seasonal weakness during the winter months. The index that represents the freight rates for shipping dry bulk commodities around the world is often a sign of demand for commodities. China is the most influential factor when it comes to moves in the BDI as it is the 800-pound gorilla when it comes to the demand side of the fundamental equation in the raw materials market. New restrictions on cleaner fuels boosted shipping rates and the BDI in 2019. The BDI closed Q3 at the 1658 level as the winter approaches and was 52.11% higher since the end of 2019.
The global pandemic has changed the world from a short-term perspective, but the impact will last long after scientists discover effective treatments and a vaccine. The bottom line for base metals and other commodities is that we will feel the effect for years to come. While the deflationary spiral was initially bearish for prices, unprecedented levels of fiscal and monetary policy stimulus could cause inflationary pressures. At the same time, as the contraction leads to lower levels of output of all of the base metals, inventories could decline, and we could see upward pressure on prices as we saw in Q2 and Q3. We could be in for very volatile price action for the foreseeable future. As we head into Q4, a seasonally weak period for the sector, prices are closer to highs than lows for 2020. I continue to expect volatility in this sector throughout the rest of 2020 and over 2021 and 2022.
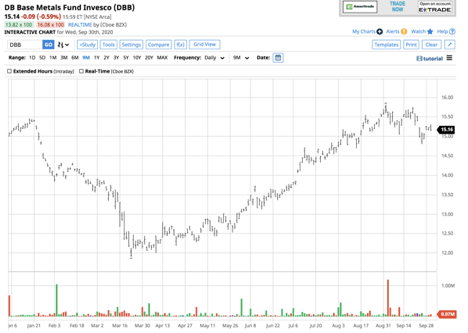
Source: Barchart
DBB is the ETF product that tracks the base metals sector. DBB moved from $13.61 at the end of Q2 to $15.14 at the end of Q3 2020. DBB rose by 11.24%. The product tracks the price action in the copper, aluminum, and zinc markets. DBB does not list lead, nickel, or tin LME forwards in its top holdings, as the prospectus says, “The index Commodities consists of aluminum, zinc, and copper-Grade A.”
DBB has net assets of $109.16 million, trades an average of 104,621 shares each day, and charges a 0.75% expense ratio.
Expect lots of price volatility in the base metals and industrial commodity sector of the commodity market over the coming quarter and beyond. While economic contraction was bearish for prices earlier this year, inflationary policies to combat the financial symptoms of the pandemic and a significant decline in production could give way to lots of two-way price volatility. Keep those stops tight and take profits when they are on the table. Markets rarely move in a straight line, which creates an environment where trading opportunities to increase. The current market conditions continue to favor trading rather than any medium or long-term positions. The trend at the end of Q3 was mostly bullish for the sector. However, the price action in copper and other base metals on October 1 was a warning sign that risk-off conditions could return in the blink of an eye.
Any investment involves substantial risks, including, but not limited to, pricing volatility, inadequate liquidity, and the potential complete loss of principal. This document does not in any way constitute an offer or solicitation of an offer to buy or sell any investment, security, or commodity discussed herein, or any security in any jurisdiction in which such an offer would be unlawful under the securities laws of such jurisdiction.
The Hecht Commodity Report is one of the most comprehensive commodities reports available today from the #2 ranked author in both commodities and precious metals. My weekly report covers the market movements of 20 different commodities and provides bullish, bearish and neutral calls; directional trading recommendations, and actionable ideas for traders. I just reworked the report to make it very actionable!