Gold and silver prices rallied strongly earlier this year, rising to multi-year highs in August. The markets had been moving sideways since but have become more volatile in recent days.
The gold price has moved up by 4 per cent and back down so far this month, while silver spiked by 7 per cent before retreating. That has investors asking, did the election affect gold and silver? What does this mean for the rest of the year and going into 2021?
This article looks at the latest market developments and the outlook for gold and silver. In addition, you can scroll down for a video in which Capital.com’s chief market strategist, David Jones, reviews the recent movement on the markets using gold and silver chart analysis.
Gold and silver news: markets return to volatility after the US election
Gold climbed above $2,000 per ounce in August, an all-time high, then retreated to trade between $1,850-1,950 per ounce. The gold price after election results was initially higher, rising to the top of the range. The announcement of progress in the development of a Covid-19 vaccine pulled the market lower on November 9, but it has the potential to continue rebounding over the longer term.

A US dollar recovery is the biggest threat to a renewed gold rally. The Dollar Index (DXY) – which measures the dollar against a basket of global currencies – has fallen by 10 per cent since the March highs, pushing up precious metal prices. The dollar could be due for an uptick after such a strong decline, but it remains in a downward trend for the time being because of the impact of the Covid-19 pandemic on US economic policy. Additional stimulus expected from the Joe Biden administration early next year is likely to weigh on the dollar in 2021, offering further support for gold.
The next resistance level for gold is the September 16 high of $1,975 per ounce, followed by $2,015 per ounce and $2,075 per ounce – bringing it back to the all-time high. There is support at the November 4 low of $1,880, then $1,848, and the psychological barrier of $1,800 per ounce.
Technical gold price analysis shows that the Bollinger bands suggest scope for a pullback on gold and the relative strength index (RSI) was overbought, but selloffs in the market are opportunities to buy. The moving average convergence divergence (MACD) gave a buy signal after the election and the market remains in an upward trend for the medium term.
In the meantime, silver reached its highest level since 2013 in August, rising above $29 per ounce, then dropped back to trade around $23-25 per ounce. The silver price after election results followed the gold market higher before retreating on the vaccine news. The RSI approached overbought and the MACD showed a buy signal after the election. The upward trend remains intact, with the market making higher highs and lower lows since the election.
Silver is likely to find some support from rising industrial production in China, as unlike gold, a large proportion of the metal is used in physical applications rather than investment. Silver mining has been disrupted by Covid-19 lockdowns, tightening supply during the year.
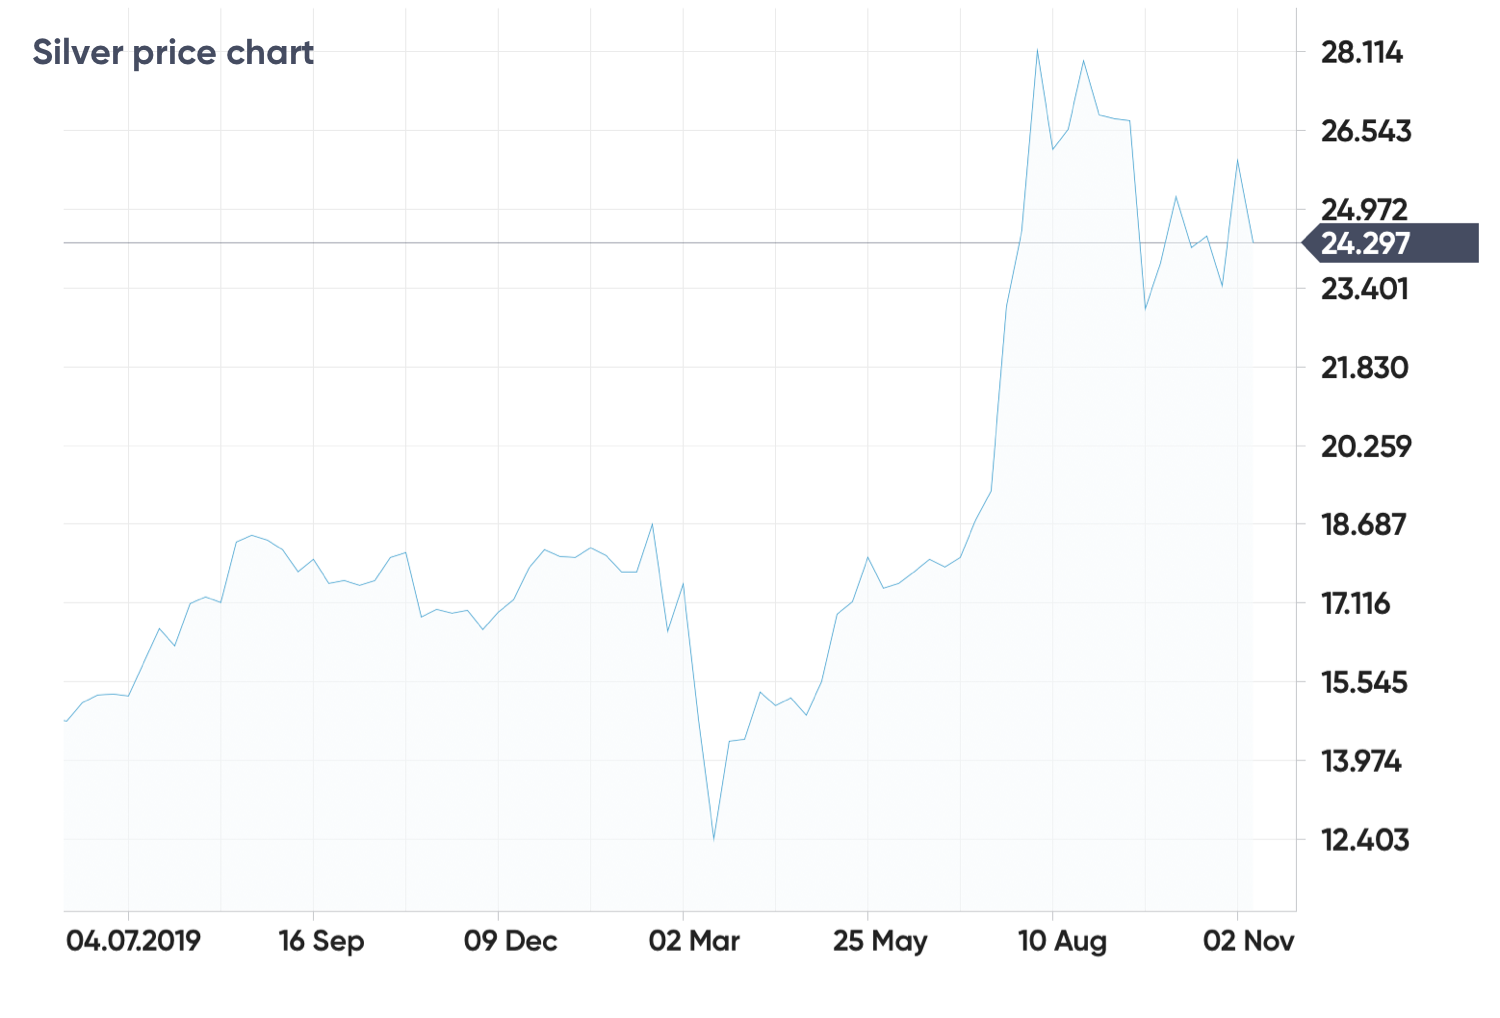 Silver technical analysis shows that the next resistance level is the September 15 high of $27.60 per ounce, the seven-year high of $29.85 set in August, and the $30 per ounce psychological level. On the downside, there is support at the $24.15 low from November 4, then $22.80 and $21.65 per ounce.
Check out this video in which Capital.com’s chief market strategist, David Jones, uses technical analysis to set up suggested silver and gold trades.