Palladium is back, moving surreptitiously from the COVID-19 lows of March, in a smooth rally with few stops that has added a whopping $1,000 to futures of the autocatalyst metal.
While gold futures racked up headlines over the past six months by making its own move into the $2,000 per ounce territory through a volatility-tinged ride, palladium scored where it mattered most: on the alpha — or absolute gain — sought by investors.
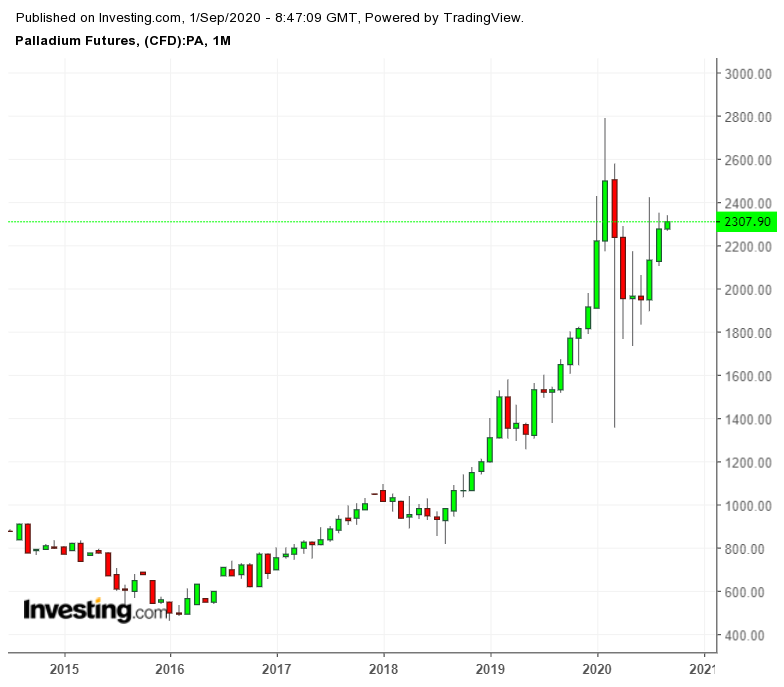 Palladium Futures Monthly Chart
Hitting a low of $1,355 on New York’s COMEX amid the start of the U.S. coronavirus lockdowns in March, palladium futures began a largely smooth ascent from May. By July, the price had soared to a four-month high of $2,420. By that point, it was already up $1,065, or 79%, from the March trough.
COMEX gold futures were, meanwhile, blazing their own trail as the plunge in the Dollar Index and U.S. Treasury yields sent investors searching for a safe-haven headlong into the yellow metal.
The difference though was gold only netted $638, or 44%, between its March low of $1,451 and last month’s all-time high of $2,089.
Gold Outperforms On Year, But With More Volatility
Gold’s rally also came with much volatility and fanfare, compared with palladium’s smooth and relatively quiet ascent.
Year-to-date, the yellow metal has still outperformed. Tuesday’s $1,995 level for gold futures left it up nearly 30% on the year. In comparison, palladium futures, which hovered above $2,310, returned 21% on the year. 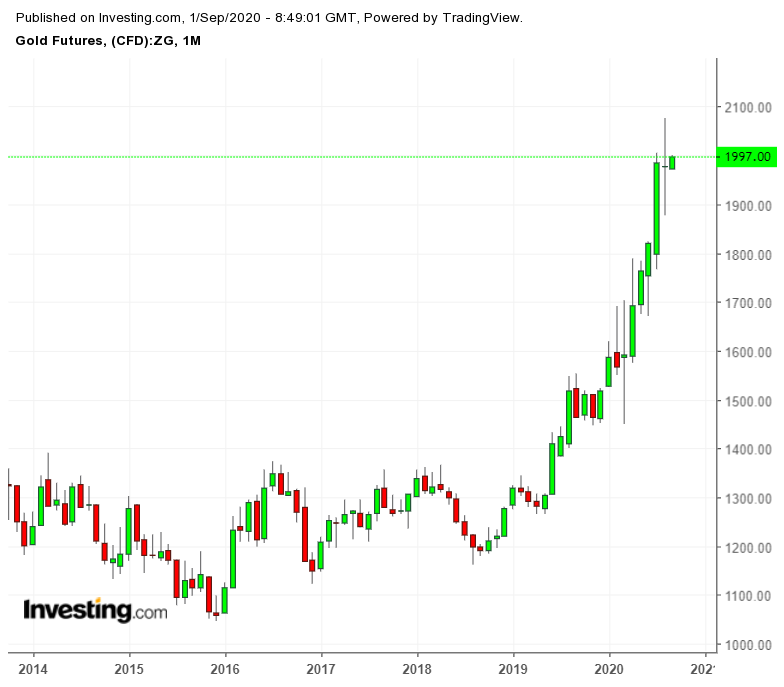 Gold Futures Monthly
But palladium could be catching a wave higher from as charts suggest.
A study of spot palladium, which is a fairer indicator of value in the autocatalyst metal, showed the emergence of tipping point for a breakout.
Spot Palladium’s Next Logical Target: $2,610
Spot palladium’s $2,292 peak on Tuesday led to a symmetrical triangle that if sustained could add 320 points at the height of the formation to the northside, charts showed.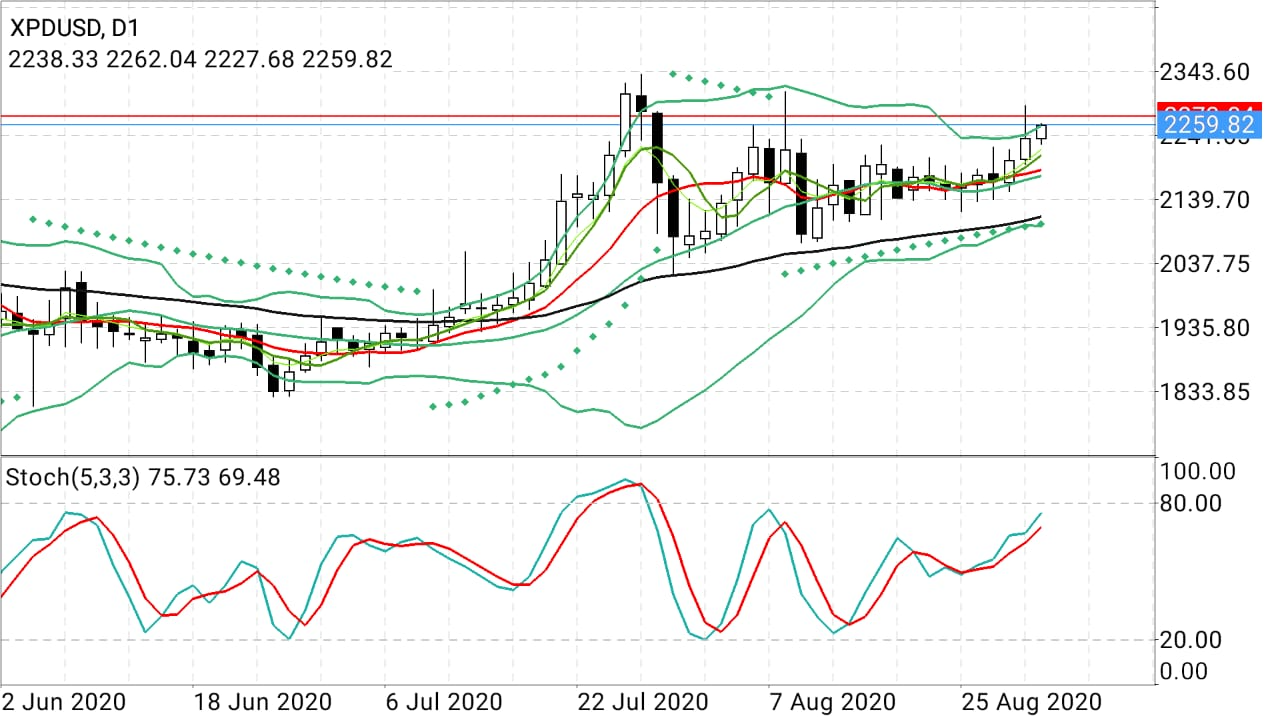 SPD/USD Daily Chart
Spot Palladium Chart, courtesy of Sunil Kumar Dixit
“The logical target is $2,610. But considering some rampant volatility that could emerge in the market at this level, strategic stop loss should be at a daily close of below 2100,” said Sunil Kumar Dixit, an independent precious metals chartist.
The spot price of palladium scaled a record high of $2,881.33 an ounce on Feb. 23, just before the coronavirus pandemic began crippling the world economy.
Until then, explosive growth in the world automotive sector, led by China, had fueled highs almost every day in palladium, a silvery-white metal critically short in supply but also critically important as a component to catalytic converters and emissions purifiers of gasoline engines.
Since 2010, above-ground stocks of palladium have declined by 5.3 million ounces (165 tons), or about 30%, analysts said.
It would be the smallest deficit since the palladium market was last in surplus in 2011, according to consultancy Metals Focus. The deficit was as much as 1.29 million ounces in 2016.
As bullion trader Kitco’s contributing author Mike McGlone noted in a second quarter commentary, the palladium/gold ratio had narrowed sharply over the past few years as gold caught up with much of the premium historically set by autocatalyst metal.
“Palladium is the most industrial of the precious metals, gold is the least,” McGlone said in that commentary.
“For much of the post 2008 crisis period, palladium was the stud among the precious metals as it rallied on the back of strong demand, notably on incremental increases from emerging markets (China), increasing emission controls and constrained supplies from South Africa and Russia.”
The palladium/gold ratio, a measure of how many ounces of gold it took to buy one of palladium, peaked at 0.70 in March of 2015. On Tuesday, it stood at just 0.14, though a renewed rally in palladium could widen the difference again in the near term.